Spruhal Invests

Value Investment Research and Advice for Indian Equity Markets


Leave a comment

When a Mutual Fund becomes a Bank

Sounds of Silence

Financial Engineering – We’ve all heard of this term. But what’s it all about? And why is it so new? Financial Engineering is term used for the past 2-3 decades at best. While real engineering has been around for 2-3 centuries …. Since the steam engine at least.

Engineering is about taking some components and fixing them together into a machine that can do much more than what the components could achieve individually. So, the whole is actually much greater than the sum of the parts.

Financial engineering also seeks to take individual parts / functions of financial instruments / financial institutions and structure them into something better. However, unlike in real engineering – in finance, the whole can never be greater than the sum of the parts. Because when it comes to finance, 10+10 will always equal 20.

However, when doing financial engineering, people sometimes get carried away and…

View original post 1,130 more words


1 Comment

Understanding ‘Competitiveness’ in a Trading Business

Trading is one of those business activities that is least understood by strategists and academicians. Especially wholesale trading. You don’t find too many case studies on wholesale trading because it does not fit well into any strategy framework.

Yet, most small and medium businesses are into trading – especially in India. Many entrepreneurs integrate forward or backward to add some manufacturing to it, but their core business remains trading.

The reason for the lack of academic research on trading is that it defies conventional economic theories on which business understanding is based. Business Strategies are formed on the economic theory that assumes perfect markets. Thus, competitive strength of a business is based on things like great products, customer service, brand positioning, etc.

But a trading business has none of these strengths. The role of trading is to iron out the imperfections in markets, so as to bring them closer to a perfect state. In my view trading plays the role of glue as well as a spring in an economy. As glue, it forms a link between buyers and sellers, while as a spring it helps absorb shocks on both demand and supply side.

So there is a definite economic value created out of trading, which cannot be ignored. The question is – How does an economy compensate its traders? And how do you assess the competitive strength of one versus another? That’s what I am trying to look at in this article.

A trader earns his revenue in the form of his ‘Gross Margin’. That’s the difference between the buying and selling price of his products. This margin depends on market forces as well as the trader’s ability to foresee the future. But, is there a science to how much this margin should be?

The way I see it, a trader performs four different roles and should be compensated for all four. These are:

  1. Broker – A trader brings together buyers and sellers, for which he deserves brokerage.
  2. Market Maker – A trader stands ready with Inventory as well as cash, to buy and sell his commodity. This provides liquidity to the market and gets rewarded by way of the ‘Bid-Ask’ spread.
  3. Financier – A trader finances his customers by way of a credit period and should earn interest on this credit.
  4. Transporter – A trader often buys and sells goods at different locations, thus taking the responsibility for logistics.

In reality all of these collapse into the trader’s ‘Gross Margin’. In most markets, it is difficult to accurately slice the gross margin into these components. But it’s a good framework to assess the value that one is adding in relation to the revenue generated. Let’s look at each of these roles in detail.

Broking

Broking is required when the buyer and seller are unable to get in touch directly. This is a result of ‘imperfect market information’. The reasons for such imperfections can be many, but one thing is clear – higher the imperfection, more will be the money left on the table for the broker. In highly evolved markets such as stock markets, brokerages have reduced to extremely low amounts. Real Estate has been a relatively higher brokerage market, but with online property listing sites picking up, brokerages in this market are also dropping.

On the other hand, you have markets where much more discretion is desired, thus making the broker’s role much more important and consequently lucrative. Fees in the ‘Uber Rich matrimonial’ market in India for example, go into lakhs of rupees. Investment Banking is another such market where millions of dollars are made in a pure broking role.

The above examples are those of ‘pure broking’ businesses, but I contend that there is an element of broking in many trading businesses, where a trader is rewarded for his knowledge of where to find the buyers and sellers.

Market Making

Market Making is the purest aspect of Trading. This is best understood in the context of stock markets or commodity markets. In these markets, there are traders who frequently buy and sell a commodity for small changes in price. At any point of time, they stand ready with some amount of commodity as well as some amount of cash to take long or short positions based on their perception of the demand-supply dynamics. This role helps in the process of price discovery as well as ensuring continuous supply of the commodity, which is essential for the smooth functioning of a market.

The ability of a trader to earn a higher margin on market making is directly dependent on his skill and experience in understanding the demand-supply dynamics of his market. One would expect a minimum return on market making to be adequate to justify one’s capital involvement. But for a highly skilled trader, it can be much higher than that.

Broking and Market Making are the core functions of trading. While broking plays the role of glue bringing buyers and sellers together, market making acts as a spring, absorbing shocks arising out of demand-supply mismatches. The other two functions – financing and logistics are non-core functions as they can be outsourced. However, these two functions are so integrated with trading, that we cannot afford to ignore them.

Financing

In several markets, traders provide credit to their customers. Even with bank credit lines available and many banks specializing in trade finance, direct credit by the seller remains widely prevalent. I contend that a seller is probably in a better position to assess the creditworthiness of his counterparties than banks, due to his day to day dealings with them. The seller is also in a better position to recover his dues on time due to his ongoing transactional relationship with the customer.

The notional interest on this credit period also forms a part of the trader’s margin. In most markets, you are able to get different quotes for cash purchase versus a purchase on credit. This difference is nothing but the interest on this credit period. Good businesses routinely earn a respectable interest spread between the interest earned on the credit they provide to their customers and their own borrowing cost from banks. This spread needs to be looked at after accounting for bad debts. It is important for a trader to assess whether he is making a positive interest spread on his credit to customers or not.

Logistics

The last critical leg of a trading business is logistics. This component is well understood by most entrepreneurs. It is a direct cost that they incur and hence need to incorporate into their gross margin while billing their customers. For most traders who outsource their logistics to third parties this would not be a problem. However, in case of traders who manage their logistics in house, it is important to assess whether they are running a cost efficient operation or not.

In order to assess the competitive strength of a trading business, you need to first break down its operations into these four sub-components. Then, you need to assess the relative importance of each of the components in the Industry where the business operates. And finally, one needs to assess the strength of that business in each of these areas to arrive at an overall picture.

There will be many questions as to how to split the business into these sub-components and doing so would involve a lot of estimation. I believe that even a broad estimate would be a good start.

A lot of my understanding of trading businesses is a result of discussions with my friend Hemanshu Chokhani.


Leave a comment

5 stocks worth gifting someone … this valentines day !!!

Sounds of Silence

It’s Valentine’s Day … the day to express your love for someone.

There are two ways in which you can express love for someone. This first is through words. ‘Words’ could mean a beautifully written poem, or a melodious song accompanied by violin. If you can pull that off, awesome.

But many of us aren’t good with words. If so, the only way left for one to express love is through a gift. The tradition of gifting is as old as love itself. I think it pre-dates the development of language. Even pre-linguistic humans such as Neanderthals would have needed some way of telling a girl that they loved her, right? Thus developed the concept of giving something precious – A Gift.

What gift you give, says a lot about what you feel for a person.

Rare objects like pearls and stones such as diamonds, rubies and emeralds have traditionally…

View original post 1,188 more words


1 Comment

Sovereign Gold Bonds – Opportunity or Trap ???

This Diwali, the Government of India has just launched its Sovereign Gold Bonds. It seems like a ‘Not to miss opportunity’. Here are some of the key features and benefits of these bonds.

Sovereign Gold Bonds

Features:

  • The Bonds are denominated in ‘Grams of Gold’ rather than in Rupees. What that means is that the Investor owns a fixed quantity of gold, which he will get on maturity.
  • The Maturity date is 8 years from allotment. But Investors have the right to redeem it (Put Option) after the 5th year.
  • The Bonds will be listed on stock exchanges. Hence, they will be liquid investments and an Investor can sell them in the market anytime.
  • The bonds carry an annual interest of 2.75% on the initial investment amount.

There seem to be many benefits to these bonds at first glance. I have listed some of them below.

Benefits:

  • You hold gold in Demat Form. Hence, there is no risk of theft or loss.
  • Since this is not physical gold, there is no dispute about its purity and no loss in value when selling it (unlike the standard 5% mark down that jewellers make to account for impurity).
  • When you hold physical gold with yourself, you do not earn any ‘interest’ on it. Here, you earn a 2.75% interest on the gold, because you have given that gold to the Government of India as a loan. This interest earned is in addition to the upside that you get on increase in gold prices.

Seems fantastic, right? At first glance, it did to me as well. But behind all this, there is one key variable. That is that you are still taking a punt on gold prices. So, for you to really earn a good return on it, gold prices need to go up.

This got me thinking – would gold prices go up in the future? Or rather, by how much do gold prices need to rise, for an Investor to make a decent return?

Let’s assume that an investor needs a pre-tax return of 7.70%. This is the current yield on a 10 year Government of India bond. The return on the gold bond can be broken up into the following sub-components.

Interest Amount + INR Depreciation v/s USD + International Gold price movement (in USD).

The first component, which is the Interest Amount, is fixed at 2.75%.

INR Depreciates against the US Dollar, because the Reserve Bank of India’s Printing presses work faster than the US Federal Reserve’s Printing presses. As per purchasing power parity theory, the depreciation of INR vs USD should be equal to the difference between the price inflation in the two economies. Over the past 7 years (2008-2015), INR has depreciated against the USD by an average of 7% every year. This was a period of very high inflation in India. The average CPI inflation during this period ranged from 8% to 10%. The US Federal Reserve on the other hand has an inflation targeting policy of 2%, and actual inflation in the US has ranged from 0% to 3% over the same period.

The RBI has now adopted a stricter Inflation targeting policy, with an inflation target of 6%. The USA on the other hand may see actual inflation of around 1% to 2% for the next few years. Thus, we can expect the INR depreciation against the USD to be around 4% to 5% over the next 5 to 8 years (tenure of the Gold Bonds in question).

If we plug these variables in our equation, we arrive at the following relationship.

2.75% (Interest Amount) + 5% (INR Depreciation v/s USD) + International Gold price movement = 7.70% (Expected Return on Gold Bonds)

What this means is that as long as International Gold prices do not fall over a 5 to 8 year period, an Investor should be able to achieve a good enough return. Sounds irresistible, doesn’t it?

International Gold Prices

But let’s not jump to conclusions just yet. Let’s analyse International Gold Prices. Over a long period of time, international gold prices are driven by one single factor – Money Supply. The more money that a central bank releases into the economy, the higher gold prices go. But how sacrosanct is this relationship? How immediately do gold prices respond to a large fund infusion or a large fund contraction in the economy? These are some of the things worth looking at before we can come to any meaningful judgement on where gold prices are headed.

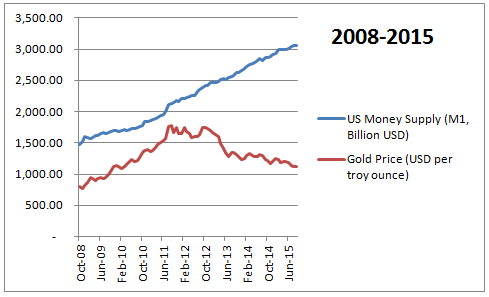
Below Charts show Money Supply (M1) and Gold Prices in the US over various periods of time. We should ideally consider global money supply – or at least that of the largest economies taken together. But I’ve been a bit lazy and considered only the US money supply, as it is the single largest factor in global monetary economics.

Chart1

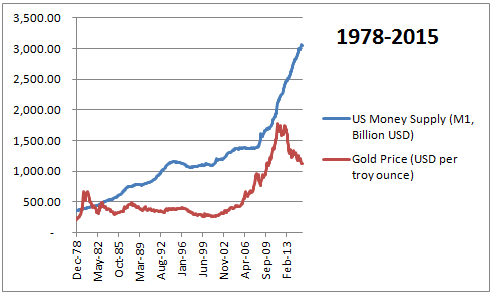
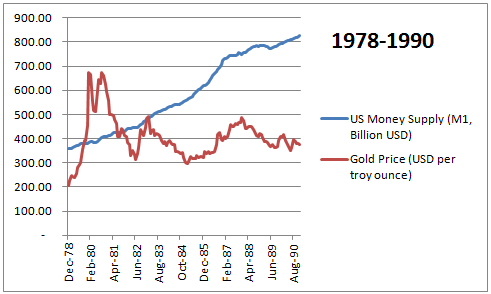
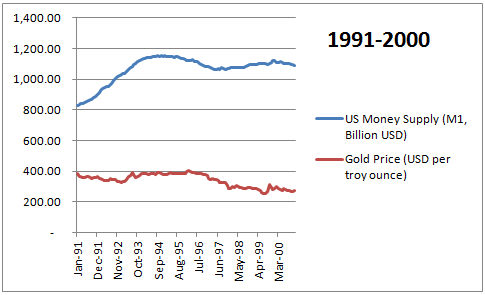
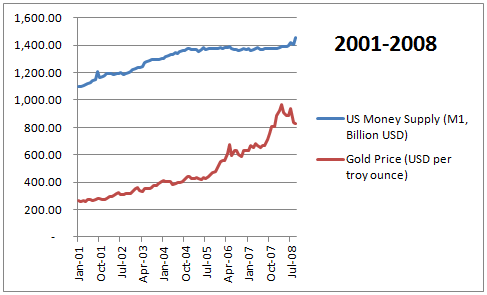
As we can observe, gold prices remained relatively range bound over a long period from 1978 to 2002, while US money supply continued to increase. Post this, gold prices started increasing rapidly for a few years, but then started crashing again. All this, while the Fed has pumped money into the economy at one of the fastest pace ever observed in history. This seems intriguing. Let’s break up this 37 year period into smaller time frames and analyse further.

Chart2

Chart3

Chart4

Chart5

While there is a definite relationship between gold prices and money supply it is not a direct relationship. There is another factor at play.

After a little bit of thought, I’ve come up with one hypothesis. Gold price inflation happens when the availability of funds in an economy, exceeds the requirement of funds of that economy. Hence, the nominal GDP has to be taken into account. What we really need to look at is the money supply per unit of GDP v/s gold prices. I’m calling the Money Supply per unit of GDP as the ‘Money Multiplier’. Now, the higher the money multiplier, the higher should gold prices be. We look at this relationship in the below table.

Chart6

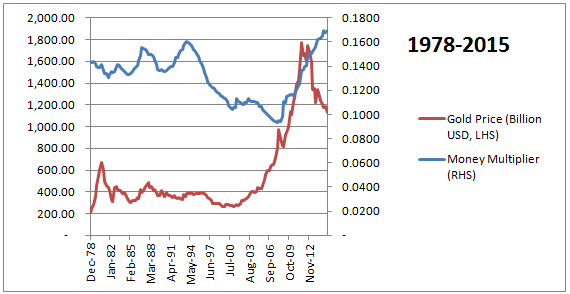
As we can see, there was a substantial drop in the money multiplier from 1993 to 2005, without any corresponding decline in Gold Prices. However, Gold Prices have substantially shot up after that, when quantitative easing led to an increase in money multiplier back from 0.10 to 0.16 levels. There’s a logical reason to this.

Electronic transactions became extremely popular from the 1990s onwards. This led to a declining requirement of cash in the economy. And hence, even with a declining money multiplier, gold prices did not deflate. But when the Fed started its quantitative easing programme, and pumped cash into the economy post 2008, gold prices shot up immediately.

In the below table, I’ve looked at the ‘Y-o-Y Growth rates’ in Gold Prices and Money Multiplier. It gives an idea of the actual directional response of one variable to another.

Chart7

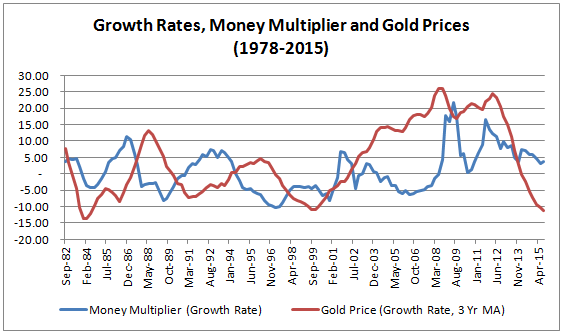
If we look at the period from 1982 to 1998, the directional response of gold price to money multiplier is almost identical, with a lag of 2-3 years. The trends after this are unclear. But I’m still inclined to believe that there is a positive directional relationship between the two and this will continue into the future.

Conclusion

So, what conclusions can we draw from all this analysis?

  • Gold prices have crashed over the past 2-3 years, in anticipation of an end to quantitative easing in the US.
  • With money supply expected to remain tight over the next few years, there is almost negligible scope for gold prices to start rising again.
  • What we might see is some more decline and then some stability in gold prices. We are not in a position to forecast the extent of such decline or the levels at which gold prices will stabilize.

As discussed earlier, we need international gold prices to at least remain stable for the Gold Bonds to be attractive. This means that I would be comfortable investing in the bonds if I could expect a combination of increasing and stable gold prices. But according to our analysis, we are actually expecting a combination of stable or declining gold prices in the next few years.

Hence, I feel that it is best to give the Gold Bonds a miss.


Leave a comment

India’s economic stalemate

My thoughts on the current economic environment …. after quite a gap.

Sounds of Silence

Over the past few months, we have been getting mixed signals about the Indian economy. There is a new government in power with a grand agenda for economic revival. On the other hand, economists have been saying that recovery is still far away. The way I see it, we are in a bad stalemate. That’s because most options before us can worsen our position than improve it. Let me elaborate this.

The Problem

The basic problem before us is low growth and high inflation. The two of these happening together are what put us in a very tight spot. Normally, high inflation is associated with high economic growth and low inflation with a recessionary period. It’s easy to manage the economy when these two move in tandem. But when they move in the opposite direction, things get much worse. A term coined for a low growth high inflation environment is…

View original post 1,048 more words


Leave a comment

A tale of two stocks … and my first 25-bagger

Every value investor dreams of the day he would get his first multi bagger. Your first five bagger… your first ten bagger … they’re special. I recently achieved my first 25 bagger. What does that mean? It means that I multiplied my money 25 times in an investment. That’s what I am going to talk about in this post. But that’s not all. I can’t talk about my biggest success without talking about my biggest failure as well. That would be a lopsided account of my investing experience. So, I’m also going to talk about a stock in which I’ve just about managed to recover my capital – after about 6 years.

The purpose of this is not to brag but to educate. Quite often I’ve written about value investing in theoretical and conceptual terms. It is only logical to follow it up with a real life example. There’s as much learning from success as there is from failure. Hence, I see it fit to talk about both of them in the same post.

There’s also a deep sense of vindication here … less for my capability as an Investor, but more for the discipline that I follow. Deep, long term, value investing has the capability of giving such mind boggling exponential returns that other forms of investing can only dream of. That’s what motivates me to write this.

A lot of people believe that multi-baggers can only be achieved in small companies that are rapidly growing or in penny stocks that are not well covered by analysts. It is widely perceived that large stocks do not get undervalued very often. Let me break that myth. I achieved my 25 bagger in a company as large and as well tracked as Tata Motors.

So here is – a tale of two stocks.

Stock 1: Tata Motors

I first purchased Tata Motors in March 2008 before the financial crisis, before the company bought JLR. My call then was that it was a good business fundamentally underpriced. After that, the company purchased JLR and the stock crashed. Then, in September 2008, Lehman brothers happened and it crashed further. I added to my positions at rock bottom prices in November 2008. At that time, there was strong evidence to suggest that the JLR business would recover post the financial crisis. This belief came from the fact that while JLR’s overall sales were down, it had increased in China and Russia, while it had declined in Europe. I reasoned that a drop in European volumes was due to market conditions rather than any problem with the brand itself, and that the growth in emerging markets showed that the brands were actually quite strong.

This turned out to be true and JLR sales improved. Although the stock price also increased, I still factored a lot of undervaluation and continued to add to my positions in 2010 and 2013. And I continue to hold this stock even today, as I still feel that the Indian operations would improve over the next few years and there is significant room for appreciation in the stock price.

Here’s how my investments fared.

Purchase Date Adjusted Purchase Price Today’s Price Absolute Return CAGR Holding period (years)
29 March 2008                          119.56          421.10 3.52x 23%                    6.18
04 November 2008                            15.76          421.10 26.72x 80%                    5.58
30 March 2010                          136.84          421.10 3.07x 31%                    4.18
14 December 2013                          373.21          421.10 1.12x 30%                    0.47


It was my second tranche of investment that earned me a 25-bagger. That translates into a compounded annual growth rate of 80%, for five and a half years. Now I’m sure you may say that a purchase at the depth of the crisis make anyone a great investor. I agree with that – coz value investing is not about timing the market. A good stock purchased even at a reasonable value should achieve good returns.

So let’s look at the other tranches of investment. This stock has returned 23% CAGR even on a pre-crisis boom time purchase in March 2008 and over 30% on subsequent purchases in 2010 and 2013. That’s what makes it a true value investment.

Now, let’s look at my other favourite investment

Stock 2: Tata Steel

I purchased Tata Steel first in March 2010 just before the Corus acquisition announcement. Then, once the acquisition was announced, I added to my positions further expecting that the company would be able to turn around Corus and make it profitable. It was a terrible mistake. Here’s how I fared. As you’ll observe, I have hardly broken even on my investment in Tata Steel.


Purchase Date Adjusted Purchase Price Today’s Price Absolute Return CAGR Holding period (years)
08 March 2010                          573.00 525 0.92x -2%                    4.24
31 May 2010                          451.00 525 1.16x 4%                    4.01


Where I went wrong with Tata Steel (and with Hindalco as well) was at a fundamental understanding of a business model. I saw no difference between a commodity business and one that owns its own brands. A commodity business is at the mercy of market forces when it comes to pricing its products and often with the procurement of its raw materials as well. The little bit that the management can do is to lower its operating costs. And that may or may not be enough in the face of adverse market conditions. This fundamental uncertainty means that an investor cannot project a constant growth rate and value such companies. That’s a mistake I made and suffered badly.

I did not understand the steel market then. Nor do I understand it now. And that should have been reason enough for me to stay away from the stock. I realized this when I read ‘One Up on Wall Street’ by Peter Lynch, about a year after getting into this stock. Realizing that I didn’t understand this company should have been reason enough for me to exit it – irrespective of the price. But alas – my emotions got the better of me and I have waited to break even. I didn’t want to ‘book a loss’. I still hold this stock – knowing that I have no clue what is happening in the steel industry. That’s what makes this such a bad investment – at all levels. It is a series of bad decisions.

In Conclusion

This is a happy time for me and I can’t end this post on a sad note. It takes years of research to find investment opportunities. It takes a lot of conviction to go against popular wisdom and invest in something that’s not a ‘hot pick’ at the time. But there comes a time … one in a while, when the decisions you took months ago … sometimes years ago, suddenly bears fruit. You can never predict when that will happen, but when it does you really feel rewarded for all the effort that you put in over the years.

Personally, Tata Motors is very special to me. It is an investment from a time when I was really cash strapped. In 2008, I was doing my CA articleship, living off a meagre stipend. I had to save up 3-4 months’ salary for buying just a small quantity of shares. Seeing something from that time having done so well has meaning beyond just the numbers.

This first multi-bagger I must dedicate to all those that have inspired me to become a value investor. Benjamin Graham, Warren Buffett, Peter Lynch and Robert Kiyosaki.


Leave a comment

Why the average investor underperforms

Sounds of Silence

“I have 1,00,000 Rupees that I can spare. What’s a good stock or mutual fund to invest in?” This is one of the most common questions people ask when it comes to investing. This question often comes from people who can afford the best financial advisors – successful professionals and high net worth individuals. Ever wondered why?

Do financial advisors do such a bad job that their clients continuously keep looking outside for advice? And how is it that the same investment professionals do a fantastic job when it comes to advising institutional clients like pension funds and insurance companies.

In order to understand this better, I have created a framework (That’s what MBAs do – create frameworks). I call it the Investor’s pyramid. This pyramid explains the entire Investment Decision making process. And it holds good for all investors – Institutions as well as individuals.

Investing Pyramid

Let me explain each…

View original post 1,083 more words